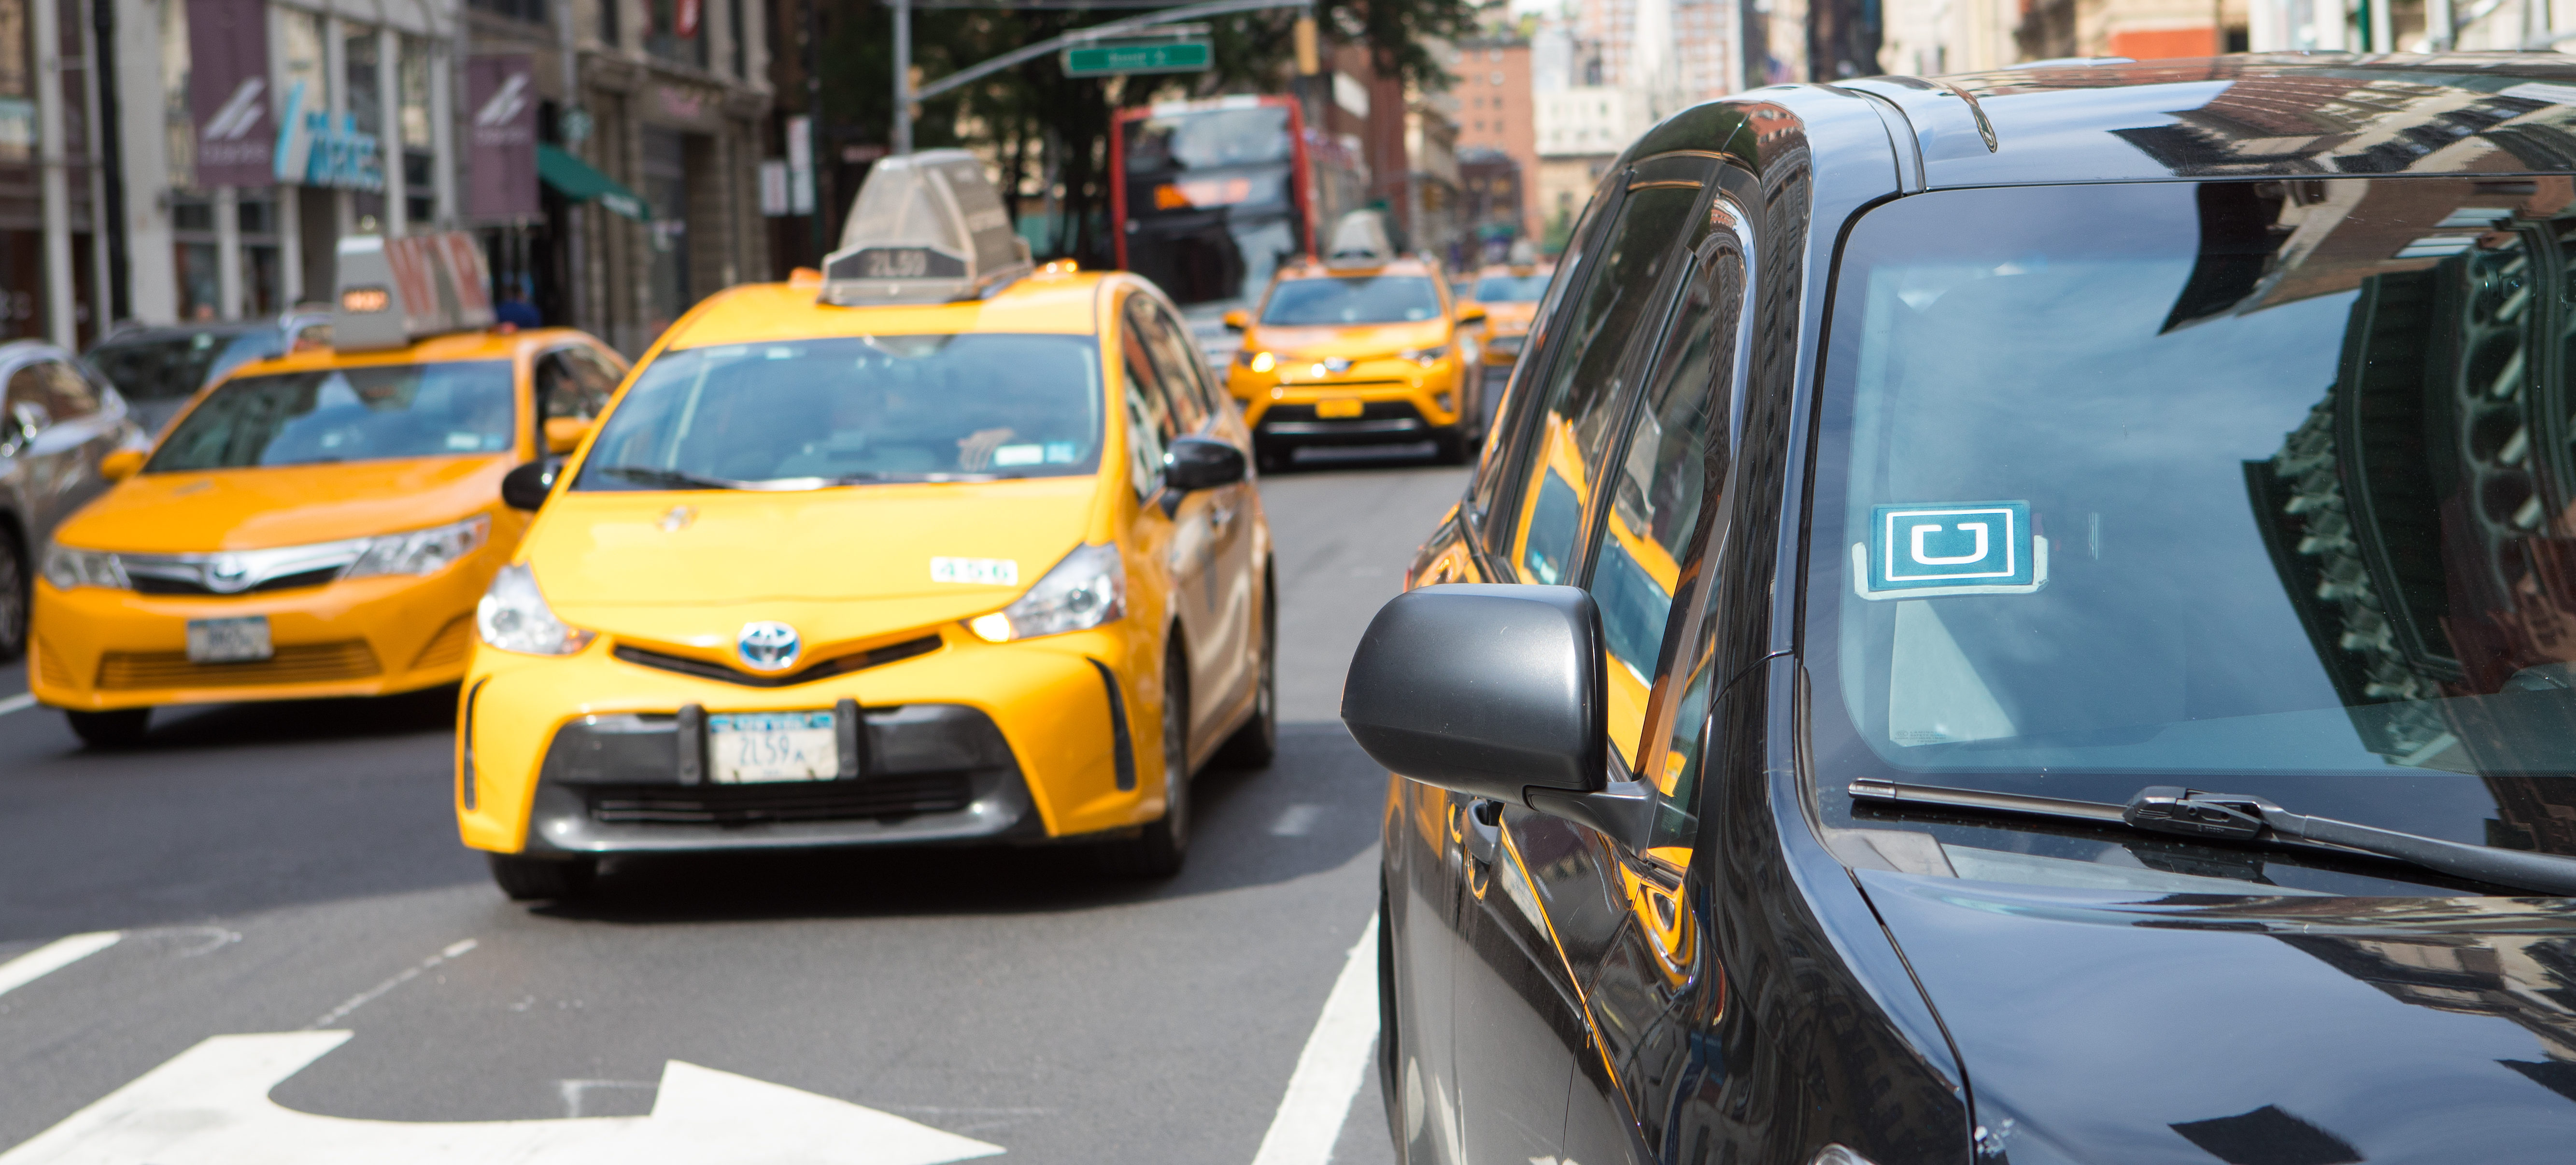
Seventy percent of U.S. business travelers prefer ride-sharing services such as Uber and Lyft over traditional taxis, business travelers in the Americas in general—as well as in Europe and Asia-Pacific—prefer taxis, according to a new survey.
This was among the topics showing the greatest variance in a survey of travelers’ preferences released Tuesday by CWT, a business-to-business travel management platform. Travelers from the three regions participated in the study.
Ride-Sharing or Taxis?
Sixty-three percent of business travelers in the Americas prefer ride-sharing services over taxis, followed by 44 percent in Asia-Pacific and 31 percent in Europe, according to the survey. In the Americas, the United States (70 percent) had the greatest preference for ride-sharing among the countries surveyed, followed by Brazil (66 percent), Mexico (61 percent), Argentina (51 percent) and Canada (43 percent).
In Asia-Pacific, India (58 percent) topped the list, trailed by Singapore (55 percent), China (36 percent), Australia (35 percent) and Japan (15 percent).
The European results were: The Netherlands (65 percent), Sweden (53 percent), United Kingdom (52 percent), France (48 percent), Italy (46 percent), Belgium (44 percent), Spain (42 percent) and Germany (32 percent).
“These findings provide fascinating and sometimes counter-intuitive insights into how global business travelers approach their journeys,” said Niklas Andreen, executive vice president and chief travel experience officer for CWT. “We see significant differences between regions.”
Andreen provided his perspective on the difference between American and European preferences.
“Let’s start with the history before ride-share,” he says. “In Europe, there has been a largely government-financed, developed taxi system in most cities, leading to a stronger tendency to take taxis everywhere. In the U.S., there’s a natural tendency to get a rental car when you land. You often see that when European and American colleagues arrive at the same location, Americans will take the car and Europeans will take a taxi to the meeting and to the hotel, assuming they can walk around. Ride-share has replaced the need to rent a car, but has not heavily influenced Europeans.
Window or Aisle Seat?

Andreen notes that the survey also found disparity among regions over preference for a window or an aisle seat.
Sixty-six percent of all business travelers surveyed prefer window over aisle seats, but the portion ranges from 71 percent in Asia-Pacific to 65 percent in Europe and 59 percent in the Americas. Fifty-one percent of U.S. business travelers prefer aisle seats to window seats—the only country to prefer aisle seats. On the other hand, 83 percent of Brazilian business travelers opt for window seats, the largest portion of any country.
“Many people tend to want to sleep on a flight so that they have something to lean against,” Andreen says. “Also, people prefer to be the ones to ask if they need to get out, rather than have other passengers climbing over them. By having a window seat, you are less exposed to other people walking up and down the corridor, disrupting you with serving carts and elbows.”
Miss a Flight or Get Separated from Luggage?
Survey participants also were asked if they would prefer missing a flight rather than being separated from their luggage. Overall, 52 percent said they would prefer missing a flight—70 percent in Asia-Pacific, 68 percent in Europe and 57 percent in the Americas. The country-by-country results for preferring to miss a flight ranged from The Netherlands (35 percent) to Germany (68 percent).
More than 2,700 business professionals who traveled for business four or more times in the previous 12 months participated in the survey, which was conducted by Artemis Strategy Groups from Jan. 29 to Feb. 9, 2019.
Overwhelming Majority Willing to Share Travel Preferences
The CWT survey also examined what portion of business travelers from each of the regions and countries willing to share their travel preferences information with apps and travel industry staff. The overwhelming majority of participants in every country surveyed indicated they are either somewhat willing or extremely willing to share their information.
“The baby boomer generation has grown confident in sharing their information much more than has historically been the case,” Andreen says. “People realize the benefits they get today and how sharing information can provide them a better on-board service and better service while traveling.
“For companies, it’s useful to know travel preferences because it allows us to tailor our offerings to our travelers effectively. On the other hand, if travelers feel their confidence has been betrayed, they will withdraw much quicker than historically.”
The complete results are listed below.
| Location | Not Willing | Somewhat Willing | Extremely Willing |
| Total Americas | 10% | 44% | 47% |
| United States | 11% | 45% | 44% |
| Canada | 13% | 48% | 39% |
| Mexico | 6% | 42% | 52% |
| Brazil | 5% | 38% | 57% |
| Argentina | 10% | 41% | 49% |
| Total Asia Pacific | 10% | 51% | 39% |
| Japan | 9% | 60% | 31% |
| China | 16% | 64% | 21% |
| India | 4% | 37% | 59% |
| Australia | 15% | 48% | 37% |
| Singapore | 9% | 49% | 42% |
| Total Europe | 14% | 35% | 51% |
| Belgium | 24% | 21% | 55% |
| The Netherlands | 18% | 25% | 57% |
| France | 14% | 36% | 50% |
| Germany | 10% | 39% | 51% |
| Italy | 10% | 41% | 49% |
| Sweden | 14% | 32% | 54% |
| United Kingdom | 14% | 39% | 47% |
| Spain | 8% | 47% | 45% |


